Future High LinePlot a horizontal line from the current high n bars into the future. Line is user configurable.
Works well with Ichimoku Cloud. When line (26 bars) rises into an overhead cloud, this often signals bullish price movement.
Cerca negli script per "Ichimoku Cloud"

Outside the Bollinger Bands Alerting Indicator Overview
The Outside the Bollinger Bands Alerting Indicator is a comprehensive technical analysis tool that combines multiple proven
indicators into a single, powerful system designed to identify high-probability reversal patterns at Bollinger Band extremes. This
indicator goes beyond simple band touches to detect sophisticated pattern formations that often signal strong directional moves.
Key Features & Capabilities
🎯 Advanced Pattern Recognition
Bollinger Band Breakout Patterns
- Detects "pierce-and-reject" formations where price breaks through a Bollinger Band but immediately reverses back inside
- Identifies failed breakouts that often lead to strong moves in the opposite direction
- Combines multiple confirmation signals: engulfing candle patterns, MACD momentum, and ATR volatility filters
- Visual alerts with symbols positioned below (bullish) or above (bearish) candles
Tweezer Top & Bottom Patterns
- Identifies consecutive candles with nearly identical highs (tweezer tops) or lows (tweezer bottoms)
- Requires at least one candle to breach the respective Bollinger Band
- Confirms reversal with directional close requirements
- Customizable tolerance settings for pattern sensitivity
- Visual alerts with ❙❙ symbols for easy identification
📊 Multi-Indicator Integration
Bollinger Bands Indicator
- Dual-band configuration with outer (2.0 std dev) and inner (1.5 std dev) bands that can be adjusted to suit your own parameters
- Configurable MA types: SMA, EMA, SMMA (RMA), WMA, VWMA
- Customizable length, source, and offset parameters
- Color-coded band fills for visual clarity
Moving Average Suite
- EMA 9, 21, 50, and 200 (individually toggleable)
- Special "SMA 3 High" for help visualizing and detecting Bollinger Band break-outs
- Dynamic color coding based on price relationship
Optional Ichimoku Cloud overlay
- Complete Ichimoku implementation with customizable periods
- Dynamic cloud coloring based on trend direction
- Toggleable overlay that doesn't interfere with other indicators
🚨 Comprehensive Alert System
Real-Time JSON Alerts
- Sends structured data on every confirmed bar close
- Includes all indicator values: BB levels, EMAs, MACD, RSI
- Contains signal states and crossover conditions
- Perfect for automated trading systems and webhooks
{"timestamp":1753118700000,"symbol":"ETHUSD","timeframe":"5","price":3773.3,"bollinger_bands":{"upper":3826.95,"basis":3788.32,"lower":3749.68},"emas":{"ema_9":3780.45,"ema_21":3788.92,"ema_50":3800.79,"ema_200":3787.74,"sma_3_high":3789.45},"macd":{"macd":-10.1932,"signal":-11.3266,"histogram":1.1334},"rsi":{"rsi":40.5,"rsi_ma":39.32,"level":"neutral"}}
Specific Alert Conditions
- MACD histogram state changes (rising to falling, falling to rising)
- RSI overbought/oversold crossovers
- All pattern detections (BB Bounce, Tweezer patterns)
- Bollinger Band breakout alerts
🎨 Visual Elements
Pattern Identification
- ♻ symbols for Bollinger Band breakout patterns (green for bullish, red for bearish)
- ❙❙ symbols for tweezer patterns (green below for bottoms, red above for tops)
- Color-coded band fills for trend visualization
Chart Overlay Options
- All moving averages with distinct colors
- Bollinger Bands with inner and outer boundaries
- Optional Ichimoku cloud with trend-based coloring
Trading Applications
Reversal Trading
- Identify high-probability reversal points at extreme price levels
- Use failed breakout patterns for entry signals
- Combine multiple timeframes for enhanced accuracy
Trend Analysis
- Monitor moving average relationships for trend direction
- Use Ichimoku cloud for trend strength assessment
- Track momentum with MACD and RSI integration
Risk Management
- ATR-based volatility filtering reduces false signals
- Multiple confirmation requirements improve signal quality
- Real-time alerts enable prompt decision making
Suggested Use
- Use on multiple timeframes for confluence
- Combine with support/resistance levels for enhanced accuracy
- Set up alerts for hands-free monitoring
- Customize settings based on market volatility and trading style
- Consider volume confirmation for stronger signals

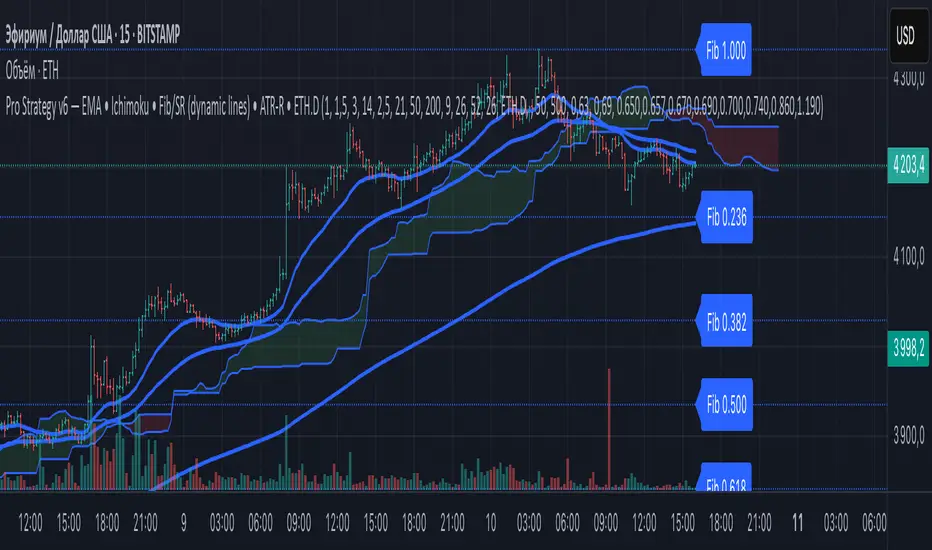
ZapTeam Pro Strategy v6 — EMA The Pro Strategy v6 script is a versatile trading strategy for TradingView that combines trend indicators, filters, and levels.
Main features:
EMA 21, EMA 50, EMA 200 — trend detection and entry signals via EMA crossovers.
Ichimoku Cloud (optional) — trend filtering and price position relative to the cloud.
ETH Dominance filter (optional) — filters trades based on Ethereum dominance (ETH.D).
ATR Stop-Loss — dynamic stop-loss based on volatility.
Two take-profits (TP1 and TP2) with optional 50/50 split.
Dynamic Fibonacci Levels — automatic or manual swings, with 1.272 and 1.618 extensions.
Custom S/R Levels — user-defined support/resistance levels.
Level lines extend across the chart and automatically adjust when zooming or panning.
Designed for trading in trending market conditions on any timeframe.
The strategy calculates position size based on percentage risk per equity.
Kumo no Nami Trend Strength Identifier T2[T69]🧠 Overview
Kumo no Nami is a custom trend strength indicator that combines Ichimoku cloud dynamics (Kumo) with wave momentum (Nami) to identify trend direction, reversals, squeezes, and breakouts using Z-Score analysis. It adapts to different modes (Ichimoku, MA, EMA) for a flexible interpretation of price structure tension vs. movement strength.
🔍 Core Logic
Kumo Width (Cloud Pressure): Measures the normalized spread (Z-Score) between two dynamic price levels (e.g., Senkou A-B or Base-Tenkan).
Nami Strength (Wave Energy): Measures how far current price dislocates from a recent range using Z-Score of the difference between close and Donchian/MA.
Z-Score Normalization: Ensures both metrics are statistically comparable, regardless of volatility regime.
Squeeze Detection: Identifies compression before potential volatility expansion.
Breakout/False Break: Detects whether movement is legitimate or noise.
Final Top/Bottom: Highlights a strong burst post-squeeze, often signaling exhaustion or trend climax.
⚙️ Features
🌀 Multiple Kumo Modes:
Kijun-Tenkan
Senkou A - B
SMA Fast - Slow
EMA Fast - Slow
🟨 Z-Score Based Squeeze Monitoring
🟥 Final Burst Alerts
🟩 Trend Continuation or Fake-out Detection
🎨 Dynamic Background Coloring for visual signal clarity
🔧 Configuration
📊 Inputs
Kumo Mode (kt, sab, sfs, efs) – Choose method to compute Kumo (Cloud) width.
Kumo Lookback – Lookback period for cloud Z-Score analysis.
Nami Lookback – Lookback period for wave dislocation measurement.
Squeeze Threshold – How low Z-Kumo must fall to signal potential squeeze.
Burst Thresholds:
Burst Kumo → Z-Kumo must rise above this to be considered bursting.
Burst Nami → Nami Strength threshold for final trend climax.
Ichimoku Config – Tenkan, Kijun, Senkou B, and displacement.
MA Config – For Fast/Slow variants, SMA/EMA lengths.
🧪 How It Works
Compute the Kumo Width depending on selected mode.
E.g., |Tenkan - Kijun| or |Senkou A - Senkou B|
Normalize this width with its Z-Score to get Z-Kumo Width.
Compute Nami Strength:
Z-Score of how far close deviates from a Donchian channel or moving average.
Evaluate signal logic based on the two:
📈 Behavior & Signals
Trend Range (Sideways Consolidation)
=>Z-Kumo < 0 and |Nami Strength| > 2
False Break (No meaningful price movement)
=>Z-Kumo < 1 and |Nami Strength| < 1
Squeeze Watch (Potential breakout loading)
=>Z-Kumo < Squeeze Threshold
Final Burst / Climax
=>Z-Kumo > 2.5 and |Nami Strength| > 3
Bullish Breakout
=>Z-Kumo > 1 and Nami Strength > 2 and not false break
Bearish Breakout
=>Z-Kumo > 1 and Nami Strength < -2 and not false break
Reversal Detection
Crossovers of Nami Strength across 0 (bull/bear) while not in squeeze
🧠 Advanced Concepts Used
Z-Score:
=>(value - mean) / standard deviation for detecting statistically significant moves.
Squeeze Principle:
=>Low volatility → potential buildup → expansion.
Price Dislocation (Wave Strength):
=>Measures how far current price is from its mean range.
=>Cloud Tension (Kumo Z-Score):
=>Reflects pressure or neutrality in the price structure.
Trend Confirmation:
=>Only if both metrics agree and no false break conditions are met.

Volume Based Analysis V 1.00
Volume Based Analysis V1.00 – Multi-Scenario Buyer/Seller Power & Volume Pressure Indicator
Description:
1. Overview
The Volume Based Analysis V1.00 indicator is a comprehensive tool for analyzing market dynamics using Buyer Power, Seller Power, and Volume Pressure scenarios. It detects 12 configurable scenarios combining volume-based calculations with price action to highlight potential bullish or bearish conditions.
When used in conjunction with other technical tools such as Ichimoku, Bollinger Bands, and trendline analysis, traders can gain a deeper and more reliable understanding of the market context surrounding each signal.
2. Key Features
12 Configurable Scenarios covering Buyer/Seller Power convergence, divergence, and dominance
Advanced Volume Pressure Analysis detecting when both buy/sell volumes exceed averages
Global Lookback System ensuring consistency across all calculations
Dominance Peak Module for identifying strongest buyer/seller dominance at structural pivots
Real-time Signal Statistics Table showing bullish/bearish counts and volume metrics
Fully customizable inputs (SMA lengths, multipliers, timeframes)
Visual chart markers (S01 to S12) for clear on-chart identification
3. Usage Guide
Enable/Disable Scenarios: Choose which signals to display based on your trading strategy
Fine-tune Parameters: Adjust SMA lengths, multipliers, and lookback periods to fit your market and timeframe
Timeframe Control: Use custom lower timeframes for refined up/down volume calculations
Combine with Other Indicators:
Ichimoku: Confirm volume-based bullish signals with cloud breakouts or trend confirmation
Bollinger Bands: Validate divergence/convergence signals with overbought/oversold zones
Trendlines: Spot high-probability signals at breakout or retest points
Signal Tables & Peaks: Read buy/sell volume dominance at a glance, and activate the Dominance Peak Module to highlight key turning points.
4. Example Scenarios & Suggested Images
Image #1 – S01 Bullish Convergence Above Zero
S01 activated, Buyer Power > 0, both buyer power slope & price slope positive, above-average buy volume. Show S01 ↑ marker below bar.
Image #2 – Combined with Ichimoku
Display a bullish scenario where price breaks above Ichimoku cloud while S01 or S09 bullish signal is active. Highlight both the volume-based marker and Ichimoku cloud breakout.
Image #3 – Combined with Bollinger Bands & Trendlines
Show a bearish S10 signal at the upper Bollinger Band near a descending trendline resistance. Highlight the confluence of the volume pressure signal with the band touch and trendline rejection.
Image #4 – Dominance Peak Module
Pivot low with green ▲ Bull Peak and pivot high with red ▼ Bear Peak, showing strong dominance counts.
Image #5 – Statistics Table in Action
Bottom-left table showing buy/sell volume, averages, and bullish/bearish counts during an active market phase.
5. Feedback & Collaboration
Your feedback and suggestions are welcome — they help improve and refine this system. If you discover interesting use cases or have ideas for new features, please share them in the script’s comments section on TradingView.
6. Disclaimer
This script is for educational purposes only. It is not financial advice. Past performance does not guarantee future results. Always do your own analysis before making trading decisions.
Tip: Use this tool alongside trend confirmation indicators for the most robust signal interpretation.

Ichimoku SentinelThis version of the Ichimoku Cloud features an alarm system helping you to catch entry and exit points and get warnings when you have to act to secure your profit.
Only relevant alerts will be triggered. For instance, if you're in a uptrend there will be alerts only when the Price crosses down Tenkan, not when crossing up.
Also, the frequent Tenkan-Kijun-Price-crossovers which occur when the price is hovering in the cloud will also not trigger alerts.
There is a warning alert when the price is approaching the cloud which is an early sign that the end of the trend is near.
You can define this warning distance to the cloud in the settings.
Conditions for long entry are the traditional triple:
- Price and Chikou-Sen above Cloud
- Chikou-Sen above Price
- Tenkan-Sen above Kijun-Sen
For Short Entries accordingly.
For Exit alerts you can chose between these options:
a) Price crosses Kijun (default)
b) Tenkan crosses Kijun
c) Price crosses Tenkan
Barcoloring : Green candles when above cloud (considered an uptrend), red when below (downtrend) and orange when within the warning distance from the cloud (consolidation)

Ichimoku Score Indicator [tanayroy]The Ichimoku Cloud is a comprehensive indicator that provides a clear view of market states through five key components. By analyzing the interaction between these components and the asset's price, traders can gain insights into trend direction, momentum, and potential reversals.
Introducing the Ichimoku Score System
I have developed a scoring system that quantifies these interactions, offering an objective method to evaluate market conditions. The score is calculated based on the relative positioning of Ichimoku components, with adjustable weightings via user input.
Scoring Criteria
Each component contributes to the overall score as follows:
Price vs. Cloud (Kumo) & Other Components
Price vs. Kumo → 2 Points
Price vs. Kumo Shadow → 0.5 Points
Tenkan vs. Kijun
Tenkan vs. Kijun → 2 Points
Tenkan vs. Kumo → 0.5 Points
Kijun vs. Kumo → 0.5 Points
Tenkan Slope → 0.5 Points
Kijun Slope → 0.5 Points
Chikou Span Interactions
Price vs. Chikou → 2 Points
Chikou vs. Kumo → 0.5 Points
Chikou Consolidation → 0.5 Points
Senkou Span Analysis
Senkou A vs. Senkou B → 2 Points
Senkou Slope → 0.5 Points
Price vs. Key Levels
Price vs. Tenkan → 2 Points
Price vs. Kijun → 2 Points
Interpreting the Score
The aggregate score functions as an oscillator, fluctuating between a range of ±16.0.
A higher score indicates strong bullish momentum.
A lower score suggests bearish market conditions.
To enhance readability and smooth fluctuations, a 9-period SMA is applied to the score.
Application in Algorithmic Trading
This scoring system helps integrate Ichimoku Cloud principles into algorithmic trading strategies by providing a structured and quantifiable method for assessing market conditions.
Would love to hear your feedback! 🚀 Let me know how this system works for you.

TrendMasterPro_FekonomiTrend Change and Start Signals with Weighted Conditions
The Trend Change and Start Signals with Weighted Conditions indicator leverages various technical analysis tools to generate reliable buy and sell signals. This indicator helps investors more accurately identify trend changes and start signals in the market.
Features:
Utilizes popular technical analysis tools such as MACD, RSI, EMA, and Ichimoku Cloud.
Enhances signal accuracy with additional indicators like ADX and Volume Increase.
Allows users to adjust the weights of each condition to set their importance.
The Confidence Level parameter lets you adjust the accuracy rate of the signals.
Visual Signals make it easy to track buy and sell points directly on the chart.
How It Works:
Condition Weights: Users assign weights to indicators like MACD, RSI, EMA, and Ichimoku Cloud. If you have no idea, use default settings.
Condition Fulfillment: Checks if the conditions for each indicator are met.
Confidence Level: The total weight of the fulfilled conditions must exceed the user-defined confidence level.
Signal Generation: When these conditions are met, a buy or sell signal is generated and visually displayed on the chart.
Customization:
Personalize Signals: By adjusting the weights of the indicators used, you can personalize the signals to match your trading strategy and preferences.
Use Cases:
Short-Term Investments: Identify quick trend changes for short-term trading decisions.
Long-Term Investments: Detect long-term trend starts and changes for strategic investment decisions.
Technical Analysis: Combine different technical analysis tools for more comprehensive and reliable analyses.
With this indicator, you can better understand market movements and make more informed investment decisions. Try it now and enhance your trading strategy!
by Fekonomi

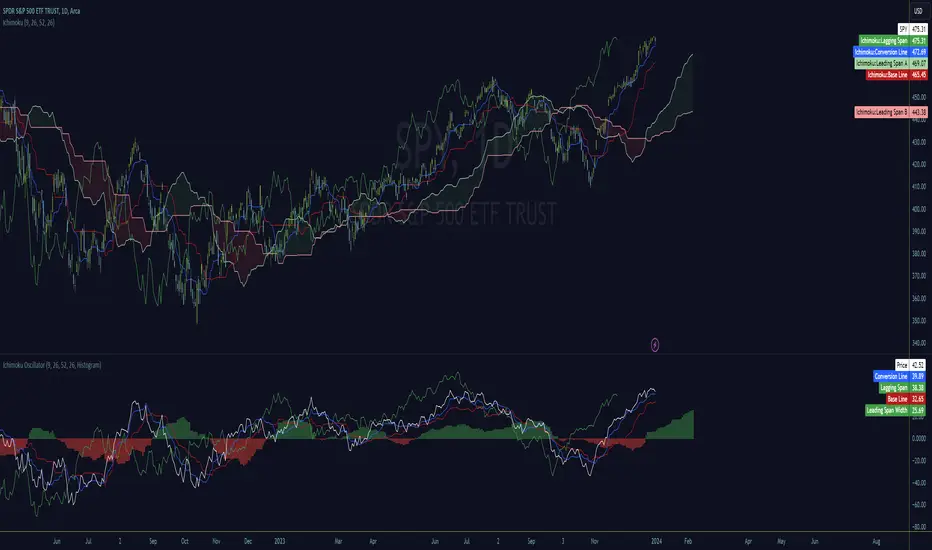
Ichimoku OscillatorFans of the Ichimoku cloud indicator may enjoy this lower study version.
It's all the exact same representation but the cloud is converted to an oscillation in histogram or classic cloud fill formats.
All of the original lines, except Kumo cloud lines, are provided but adjusted to be positionally accurate to the oscillation values.
The oscillation value is calculated simply by absolute subtraction of span a and b lines and as such become an additional width detection mechanism in what I consider to be a slightly cleaner display.
Since the entire cloud can be removed from the main chart, it's necessary to understand price location relative to the values which is calculated and displayed as the 'Price' plot. It is positionally accurate to the oscillation and cross signals can be observed.
My hope is that this serves as a foundation for others to create interesting Ichimoku lower study indicators, and to provide relief to traders looking for cleaner main charts.
I've done my best to ensure accuracy but if any issues are found please let me know.
Feedback and suggestions are welcome, enjoy.
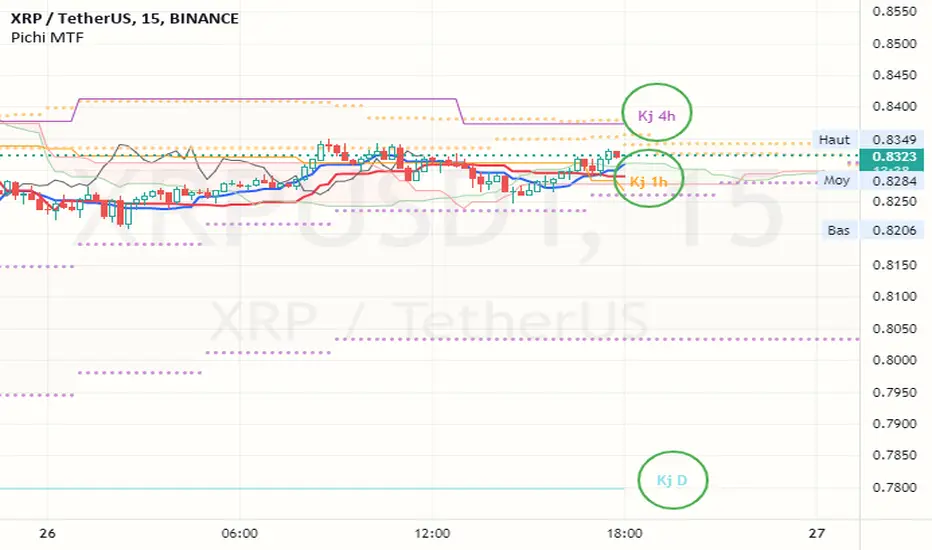
Pax24 MTF IchimokuPax24 Multiple Time Frames and Adaptative Ichimoku Cloud.
(based on the scripts : MTF Selection Framework by PineCoders and MTF ichimoku by anthonyf50)
Possible display :
- four differents Ichimoku, 1 current and 3 from higher UT (depending on your actual UT)
- Tenkan, Kijun, Chikou and Kumo for all
- labels : offset from line, color if you change style and with/without abbreviation
The 3 upper ichimoku you can display depends of your actual Time Frame :
- M1, M3 => M5 M15 H1
- M5 => M15 H1 H4
- M15, M30, M45 => H1 H4 D
- H1, H2, H3 => H4 D W
- H4, H6, H12 => D W M
- D => W M
- W => M
- M => none other
To add the indicator on your graph, go to "Indicators" then search for "Pax24 MTF Ichimoku" and add the script to your favorites.
-------- CONFIGURATION -------
Base : ichimoku numbers
ichimoku and +1 +2 +3 : Show the first ichimoku (actual UT) and 3 others (higher UT)
for each :
Tenkan : Show the Tenkan
Kijun : Show the Kijun
Chikou : Show the Chikou (Lagging span)
Kumo : Show the Kumo
Label : Show the labels
Offset : Label offset
Color : Label color (because you can't change the style of the label in "Style")
Abbreviation : Label abbreviation (Tk = Tenkan)
If you want to best see others UT kumo, change transparency in style for Kumo
There may be slow display since TradingView requires a minimum of candles to make these calculations. Just zoom out and then zoom in to fix the problem (especially for kumo).
Box Trade with RenatoTrade with Renato contains 3 tackled, Ichimoku Cloud, Various Moving Averages and Bollinger Bands.
This strategy is simple and effective, always looking for clearer entry signals to trade.
Description:
Long
Conversion Line crossing Ichimoku Baseline from bottom to top, Start at candlestick low after crossing!
Conversion Line Crossing Bollinger Band Base, End!
STOP on the Bottom Line of the Band.
Short
Conversion Line crossing Ichimoku Baseline from top to bottom, Start at candlestick low after crossing!
Conversion Line Crossing Bollinger Band Base, End!
STOP at the Top Line of the Band.
Settings:
You can edit as colors in the indicator settings and select the media you want to use.
Also the possibility to activate in settings such as Bollinger bands.
There is also the possibility to edit as medium media.
You can also disable or enable Ichimoku Cloud
----------------------------------------------------------------------------------------------------------------------------------------------------------------------------------
Trade with Renato contém 3 estratégias, Nuvem de Ichimoku, Diversas Médias Móveis e Bandas de Bollinger.
Essa estratégia é simples e eficaz, procurando sempre sinais de entradas mais claros para o trade.
Descrição:
Long
Conversion Line cruzando a Base Line Ichimoku de baixo para cima, Início na minima do candle após cruzamento!
Conversion Line cruzando a Base da Banda de Bollinger, Fim!
STOP na Linha Inferior da Banda.
Short
Conversion Line cruzando a Base Line Ichimoku de cima para baixo, Início na minima do candle após cruzamento!
Conversion Line cruzando a Base da Banda de Bollinger, Fim!
STOP Na Linha Superior da Banda.
Configuração:
Você pode editar as cores nas configurações do indicador e selecione as medias que deseja usar.
Também a possibilidade de ativar nas configurações, as Bandas de bollinger .
Há também a possibilidade de editar as médias moveís.
Você também pode desativar ou ativar a Nuvem de Ichimoku

Daily, Monthly & Weekly Clouds (use on day chart)This indicator offers Ichimoku clouds for periods 1, 7, and 30. When used on the DAILY chart these correspond to the D, W & M time frames respectively.
The indicator just has the clouds right now because that's all I use. It doesn't have tenken, kijun or anything right now.

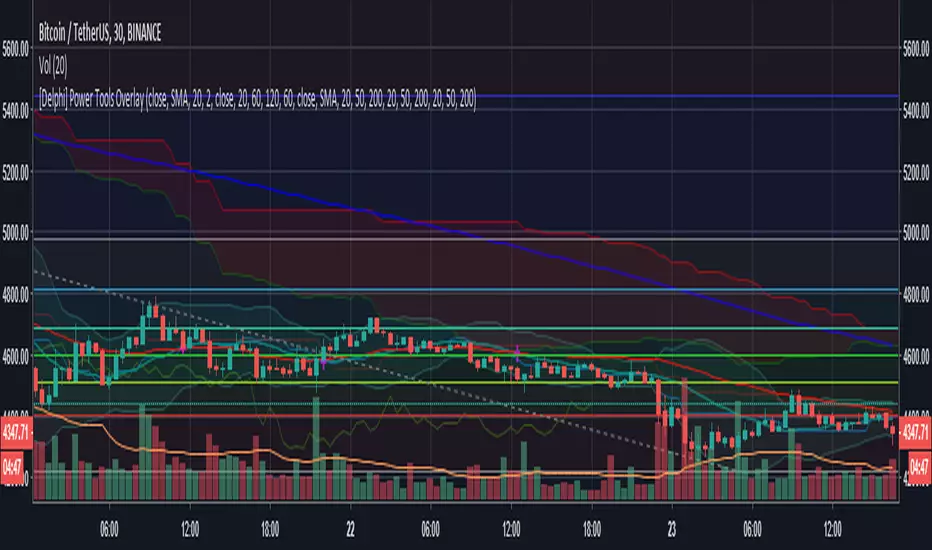
[Delphi] Power Tools OverlayFEATURE
3EMA 3MA 3WMA 3MA-3EMA 3EMA-3WMA 3WMA-3MA
Bollinger Bands
Ichimoku Cloud
//******************************************************************************
// Power Tools Overlay
// Inner Version 1.0 21/11/2018
// Developer: iDelphi
// Developer: astropark (Ichimoku Cloud)
//------------------------------------------------------------------------------
// 21/11/2018 Added EMA MA WMA
// 21/11/2018 Added MA-EMA EMA-WMA WMA-MA (Thanks to mariobros1 for the idea of the Simultaneous MA)
// 21/11/2018 Added Bollinger Bands
// 21/11/2018 Added Ichimoku Cloud (Thanks to astropark for all the code of the Ichimoku Cloud)
//******************************************************************************
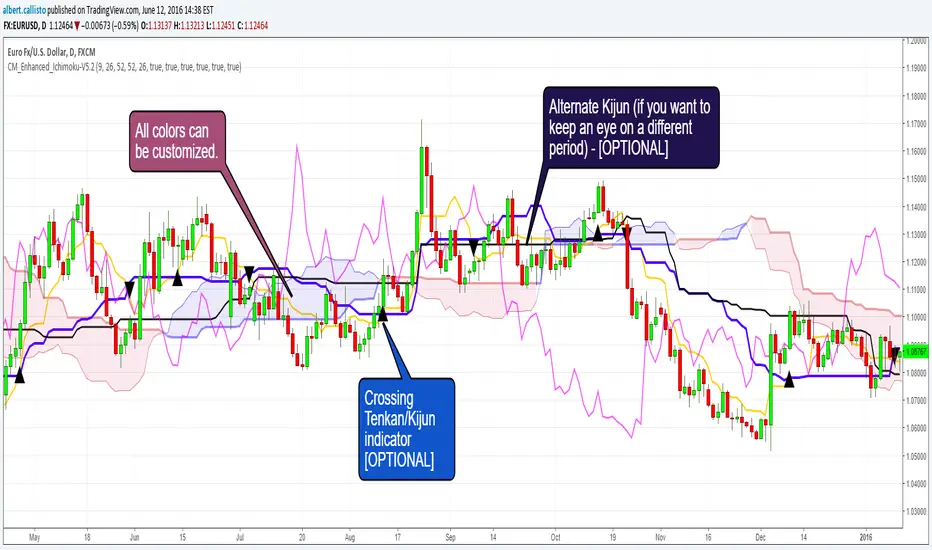
CM_Enhanced_Ichimoku Cloud-V5.2New version of the improved Ichimoku cloud
Original by Chris Moody, great work.
This indicator is a colorized Ichimoku with colors that you can change for any component. Not many changes between 5.1 and 5.2, I fixed some labels and the crossing detection, as well as the default colors.
There's not much more left we can do without radically changing the original Ichimoku. We could implement full-multiframe but you can already do that by adding several times this indicator and changing the periods.
Displayed components:
Kijun-Sen: middle of the highest/lowest prices during the last 26 periods
Tenkan-Sen: middle of the highest/lowest prices during the last 9 periods
Senkou Span A (SSA) : average of Kijun and Tenkan, projected 26 periods ahead
Senkou Span B (SSB): middle of the highest/lowest prices during the last 52 periods, and projected 26 periods ahead
Chikou Span: the closing price projected 26 periods behind.
Kumo: the cloud itself, the area between SSA/SSB.
The script also provides indication of the crossings between Tenkan and Kijun, some trading strategies are based upon that. There is also a separate Kijun with its own period for those you'd like to have this information at another timeframe. I removed the third Kijun that was in version 5.1, I don't think it was widely used and made the configuration screen too crowded. If you really need this, take a look at Donchian indicators, the Kijun is basically a Donchian on 26 periods.
Chris Moody Version (v5):
HUll Dynamic BandEducational Hull Moving Average Wave Analysis Tool
**MARS** is an innovative educational indicator that combines multiple Hull Moving Average timeframes to create a comprehensive wave analysis system, similar in concept to Ichimoku Cloud but with enhanced smoothness and responsiveness.
---
🎯 Key Features
**Triple Wave System**
- **Peak Wave (34-period)**: Fast momentum signals, similar to Ichimoku's Conversion Line
- **Primary Wave (89-period)**: Main trend identification with retest detection
- **Swell Wave (178-period)**: Long-term trend context and major wave analysis
**Visual Wave Analysis**
- **Wave Power Fill**: Dynamic area between primary and swell waves showing trend strength
- **Peak Power Fill**: Short-term momentum visualization
- **Smooth Curves**: Hull MA-based calculations provide cleaner signals than traditional moving averages
**Intelligent Signal System**
- **Trend Shift Signals**: Clear visual markers when trend changes occur
- **Retest Detection**: Identifies potential retest opportunities with specific conditions
- **Correction Alerts**: Early warning signals for market corrections
---
📊 How It Works
The indicator uses **Hull Moving Averages** with **Fibonacci-based periods** (34, 89, 178) and a **Golden Ratio multiplier (1.64)** to create natural market rhythm analysis.
**Key Signal Types:**
- 🔵 **Circles**: Major trend shifts (primary wave crossovers)
- 💎 **Diamonds**: Retest opportunities with multi-wave confirmation
- ❌ **X-marks**: Correction signals and structural breaks
- 🌊 **Wave Fills**: Visual trend strength and direction
---
🎓 Educational Purpose
This indicator demonstrates:
- Advanced moving average techniques using Hull MA
- Multi-timeframe analysis in a single view
- Wave theory application in technical analysis
- Dynamic support/resistance concept visualization
**Similar to Ichimoku but Different:**
- Ichimoku uses price-based calculations → Angular cloud shapes
- MARS uses weighted averages → Smooth, flowing wave patterns
- Both identify trend direction, but MARS offers faster signals with cleaner visualization
---
⚙️ Customizable Settings
- **Wave Periods**: Adjust primary wave length (default: 89)
- **Multipliers**: Fine-tune wave sensitivity (default: 1.64 Golden Ratio)
- **Visual Style**: Customize line widths and signal displays
- **Peak Analysis**: Independent fast signal system (default: 34)
---
🔍 Usage Tips
1. **Trend Identification**: Watch wave fill colors and line positions
2. **Entry Timing**: Look for retest diamonds after trend shift circles
3. **Risk Management**: Use wave boundaries as dynamic support/resistance
4. **Confirmation**: Combine with price action and market structure analysis
---
⚠️ Important Notes
- **Educational Tool**: Designed for learning wave analysis concepts
- **Not Financial Advice**: Always use proper risk management
- **Backtesting Recommended**: Test on historical data before live trading
- **Combine with Analysis**: Works best with additional confirmation methods
---
🚀 Innovation
MARS represents a unique approach to wave analysis by:
- Combining Hull MA smoothness with Ichimoku-style visualization
- Providing multi-timeframe analysis without chart clutter
- Offering retest detection with specific wave conditions
- Creating an educational bridge between different analytical methods
---
*This indicator is shared for educational purposes to help traders understand advanced moving average techniques and wave analysis concepts. Always practice proper risk management and combine with your own analysis.*

Ichimoku OscillatorHello All,
This is Ichimoku Oscillator that creates different oscillator layers, calculates the trend and possible entry/exit levels by using Ichimoku Cloud features.
There are four layer:
First layer is the distance between closing price and cloud (min or max, depending on the main trend)
Second layer is the distance between Lagging and Cloud X bars ago (X: the displacement)
Third layer is the distance between Conversion and Base lines
Fourth layer is the distance between both Leadlines
If all layers are visible maning that positive according to the main trend, you can take long/short position and when main trend changed then you should close the position. so it doesn't mean you can take position when main trend changed, you need to wait for all other conditions met (all layers(
there is take profit partially option. if Conversion and base lines cross then you can take profit partially. Optionally you can take profit partially when EMA line crosses Fourth layer.
Optionally ATR (average true range) is used for Conversion and baseline for protection from whipsaws. you can use it to stay on the trend longer time.
I added options to enable/disable the alert and customize alert messages. You can change alert messages as you wish. if you use ' close ' in the alert message then you can get closing price in the alert message when the alert was triggered.
There is an option Bounce Off Support/Resistance , if there is trend and if the price bounce off Support/Resistance zone then a tiny triangle is shown.
There are many other options for coloring, alerts etc.
Some screenshots:
Main trend:
Taking/closing positions:
Example alert messages:
Bounce off:
Colors:
Colors:
Colors:
Non-colored background:
P.S. For a few months I haven't published any new script because of some health issues. hope to be healthy and create new scripts in 2024 :)
Enjoy!

X48 - Strategy | BreakOut & Consecutive (11in1) + Alert | V.1.2================== Read This First Before Use This Strategy ==============
*********** Please be aware that this strategy is not a guarantee of success and may lead to losses.
*********** Trading involves risk and you should always do your own research before making any decisions.
================= Thanks Source Script and Explain This Strategy ===================
► Description
Write a detailed and meaningful description that allows users to understand how your script is original, what it does, how it does it and how to use it
This Strategy Are Combine Strategy and Indicators Alert Function For Systematic Trading User.
Strategy List, Thanks For Original Source Script , From Tradingview Build-in Script From fmzquant Github
// Channel BreakOut Strategy : Calculate BreakOut Zone For Buy and Sell.
// Consecutive Bars UP/Down Strategy : The consecutive bars up/down strategy is a trading strategy used to identify potential buy and sell signals in the stock market. This strategy involves looking for a series of bars (or candles) that are either all increasing or all decreasing in price. If the bars are all increasing, it can be a signal to buy, and if the bars are all decreasing, it can be a signal to sell. This strategy can be used on any timeframe, from a daily chart to an intraday chart.
// 15m Range Length SD : Range Of High and Low Candle Price and Lookback For Calculate Buy and Sell.
Indicators Are Simple Source Script (Almost I'm Chating With CHAT-GPT and Convert pinescript V4 to V5 again for complete almost script and combine after)
// SwingHigh and SwingLow Plot For SL (StopLoss by Last Swing).
// Engulfing and 3 Candle Engulfing Plot.
// Stochastic RSI for Plot and Fill Background Paint and Plot TEXT For BULL and BEAR TREND.
// MA TYPE MODE are plot 2 line of MA Type (EMA, SMA, HMA, WMA, VWMA) for Crossover and Crossunder.
// Donchian Fans MODE are Plot Dot Line With Triangle Degree Bull Trend is Green Plot and Bear Trend is Red Plot.
// Ichimoku Cloud Are Plot Cloud A-B For Bull and Bear Trend.
// RSI OB and OS for TEXT PLOT 'OB' , 'OS' you will know after OB and OS, you can combo with other indicators that's make you know what's the similar trend look like?
// MACD for Plot Diamond when MACD > 0 and MACD < 0, you can combo with other indicators that's make you know what's the similar trend look like?
Alert Can Alert Sent When Buy and Sell or TP and SL, you can adjust text to alert sent by your self or use default setting.
========== Let'e Me Explain How To Use This Strategy =============
========== Properties Setting ==========
// Capital : Default : 1,000 USDT For Alot Of People Are Beginner Investor = It's Capital Your Cash For Investment
// Ordersize : Default Are Setting 5% / Order We Call Compounded
========== INPUT Setting ==========
// First Part Use Must Choose Checkbox For Use of Strategy and Choose TP/SL by Swing or % (can choose both)
// In Detail Of Setting Are Not Too Much, Please Read The Header Of Setting Before Change The Value
// For The Indicator In List You Want To Add Just Check ✅ From MODE Setting, It's Show On Your Chart
// You Can Custom TP/SL % You Want
========== ##### No trading strategy is guaranteed to be 100% successful. ###### =========
For Example In My Systematic Trading
Select 1/3 Strategy Setting TP/SL % Match With Timeframe TP Long Are Not Set It's Can 161.8 - 423.6% but Short Position Are Not Than 100% Just Fine From Your Aset
Choose Indicators For Make Sure Trend and Strategy are the same way like Strategy are Long Position but MACD and Sto background is bear. that's mean this time not open position.
Donchian Fans is Simple Support and Ressistant If You Don't Know How To Plot That's, This indicator plot a simple for you ><.
Make Sure With Engulfing and 3 Candle Engulfing If You Don't Know, What's The Engulfing, This Indicator are plot for you too ><.
For a Big Trend You can use Ichimoku Cloud For Check Trend, Candle Upper Than Cloud or Lower Than Cloud for Bull and Bear Trend.

RSI + MA, LinReg, ZZ (HH HL LH LL), Div, Ichi, MACD and TSI HistRelative Strength Index with Moving Average, Linear Regression, Zig Zag (Highs and Lows), Divergence, Ichimoku Cloud, Moving Average Convergence Divergence and True Strength Index Histogram
This script is based on zdmre's RSI script, I revamped a lot of things and added a few indicators from ParkF's RSI script.
Disable Labels in the Style tab and the histogram if you don't enlarge the indicator and it seems too small.
Look to buy in the oversold area and bounce of the support of the linear regression.
Look to sell in the overbought area and bounce of the resistance of the linear regression.
Look for retracement to the moving average or horizontal lines, and divergences for potential reversal.
RSI
The Relative Strength Index (RSI) is a well versed momentum based oscillator which is used to measure the speed (velocity) as well as the change (magnitude) of directional price movements.
Moving Average
Moving Average (MA) is a good way to gauge momentum as well as to confirm trends, and define areas of support and resistance.
Linear Regression
The Linear Regression indicator visualizes the general price trend of a specific part of the chart based on the Linear Regression calculation.
Zig Zag (Highs and Lows)
The Zig Zag indicator is used to identify price trends, and in doing so plots points on the chart to mark whenever prices reverse by a larger percentage point than a predetermined variable or marker.
Divergence
The divergence indicator warns traders and technical analysts of changes in a price trend, oftentimes that it is weakening or changing direction.
Ichimoku Cloud
The Ichimoku Cloud is a package of multiple technical indicators that signal support, resistance, market trend, and market momentum.
MACD and TSI Histogram
MACD can be used to identify aspects of a security's overall trend.
The True Strength Index indicator is a momentum oscillator designed to detect, confirm or visualize the strength of a trend.

ICHIMOKU Trading betaIchimoku Kinko Hyo is a trend-following trading system with 5 indicators. All the five indicators have a different purpose and successful Ichimoku trading required in-depth analysis of all indicators. The script interpreted each indicator and develop a score to indicate the overall strength.
I have taken the idea from the book “Trading with Ichimoku Clouds by MANESH PATEL”. The scoring system is mine to get an idea about how all the indicators are performing together.
If most of the indicators are confirming then the score will be high.
I am very new to Pinescript, so waiting for your comments and review.
You can view all comments by turning the comments on.

Ichimoku + 2 base linesIchimoku + 2 base line
This indicator is a combination of Ichimoku cloud indicator with two base lines.
The first base line is the same as the Ichimoku default settings but the baseline 2 indicates an average of 108 candles in the past and it acts as a strong support and resistance level.
How to use this indicator?
You can use this indicator to see if a break out is true or is a false break. For example if the price broke up the Ichimoku cloud and base line 2 is above the price, it will probably react to that area but if it's below the price, it is a good opportunity to buy. (for sell/short position it is in the opposite way the base line 2 should be above the price)
If you want to trade in support zones base line 2 (108) is a very good area that you can wait for a good candlestick pattern to enter a position.
Caution: before using this indicator please back test it and if the results were good enough, use it as a confirmation.

[astropark] Power Tools Overlay//******************************************************************************
// Power Tools Overlay
// Inner Version 1.2.1 13/12/2018
// Developer: iDelphi
// Developer: astropark (Ichimoku Cloud), SMA EMA & Cross tools
//------------------------------------------------------------------------------
// 21/11/2018 Added EMA SMA WMA
// 21/11/2018 Added SMA-EMA EMA-WMA WMA-SMA (Thanks to mariobros1 for the idea of the Simultaneous MA)
// 21/11/2018 Added Bollinger Bands
// 21/11/2018 Added Ichimoku Cloud (Thanks to astropark for all the code of the Ichimoku Cloud)
// 23/11/2018 Show all the indicator as default
// 23/11/2018 Added a cross when single Moving Averages crossing (Thanks to astropark for the idea)
// 24/11/2018 Descriptions Fix
// 24/11/2018 Added Option to enable/disable all Moving Averages
// 10/12/2018 Added EMAs and Crosses
// 13/12/2018 indicator number fixes
//******************************************************************************

[astropark] Power Tools Overlay//******************************************************************************
// Power Tools Overlay
// Inner Version 1.2 20/12/2018
// Developer: iDelphi
// Developer: astropark (Ichimoku Cloud), SMA EMA & Cross tools
//------------------------------------------------------------------------------
// 21/11/2018 Added EMA SMA WMA
// 21/11/2018 Added SMA-EMA EMA-WMA WMA-SMA (Thanks to mariobros1 for the idea of the Simultaneous MA)
// 21/11/2018 Added Bollinger Bands
// 21/11/2018 Added Ichimoku Cloud (Thanks to astropark for all the code of the Ichimoku Cloud)
// 23/11/2018 Show all the indicator as default
// 23/11/2018 Added a cross when single Moving Averages crossing (Thanks to astropark for the idea)
// 24/11/2018 Descriptions Fix
// 24/11/2018 Added Option to enable/disable all Moving Averages
// 10/12/2018 Added EMAs and Crosses
//******************************************************************************

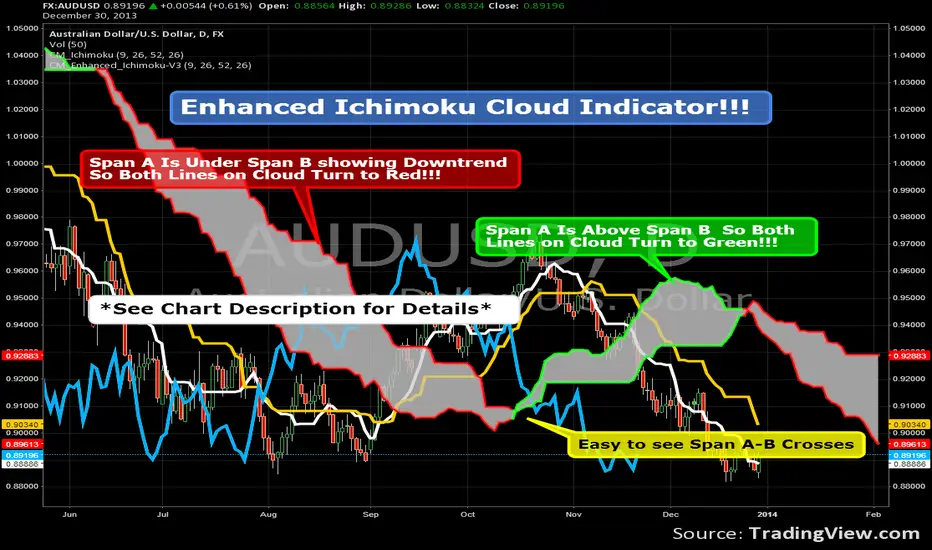
Enhanced Ichimoku Cloud Indicator!!!There are two Custom Ichimoku Indicators on the chart.
The one that is hidden is the Ichimoku Indicator with
The correct names for the lines Under the Style Tab.
The Indicator shown is coded so when the cloud is in
a down trend both lines turn Red.
When the Cloud is rising both lines turn to Green.
Because of the code used in order to switch the colors of
Both Lines at the same time I couldn't name Senkou Span A
and Senkou Span B in the "Styles" Tab.
You can still modify the colors to customize chart.